This post is written by Sarah Asson, Annie Maselli, and Ruth Krebs Buck, graduate students at Penn State University and research assistants on the Longitudinal School Attendance Boundary Survey (LSABS). LSABS is led by Dr. Erica Frankenberg, Penn State Professor of Education and Demography at Penn State, and Dr. Christopher Fowler, Associate Professor of Geography and Demography at Penn State. The research brief discussed in this post is also co-authored former research assistant Ian Burfoot-Rochford. The LSABS project is supported by funding from the National Science Foundation, Penn State University’s Social Science Research Institute, Population Research Institute, College of Earth and Mineral Sciences, and College of Education.
Over the past three years, our team at Penn State has been working to collect current and historical school attendance zone boundaries (what we call AZBs) and build a publicly available database, the Longitudinal School Attendance Boundary Survey (LSABS). The goal is to collect AZB maps from 1990, 2000, 2010, and 2020 for as many school districts as possible across the United States. We wrote more about this project in a previous post for the SD Notebook.
You can get in touch with us through our project website: https://lsabs.geog.psu.edu/. There, you can explore the publicly available data, share AZB data from your own district, and learn about how to help us digitize existing data. You can also access a non-paywalled version of the brief here.
AZBs are the lines within a school district that assign students to specific elementary, middle, and high schools—and they are really important for a few reasons. First, AZBs shape students’ access to schooling opportunities and resources since not all public schools are equal, even within the same district. They also shape patterns of school segregation by assigning students to schools. Finally, they can shape residential segregation by influencing families’ decisions about where to live. Despite how important they are, AZBs are not systematically monitored. Individual district administrators and school boards draw and redraw AZBs as they see fit, with little to no oversight from outside the district. Our project is collecting longitudinal AZB data in order to provide the capacity for more oversight. Specifically, we wish to study how AZBs have changed over time and how they’ve sorted the U.S.’s ever-diversifying population.
We recently published a research brief describing the lessons and outcomes of our data collection efforts so far. In short, we’ve had some success collecting boundary data, but we’ve also run into a number of systematic barriers that have shaped our sample.
As of the writing of our research brief in February of 2022, we had collected the following data:
| Year of data | Number of school districts for which LSABS contains complete AZB data |
| 1990 | 129 |
| 2000 | 389 |
| 2010 | 919 |
| 2020 | 1,384 |
| All years | 173 |
Note: The count of districts for which we have “all years” of data exceeds the count of districts with 1990 data because there were several districts that had only one elementary, middle, and high school open in 1990 and thus did not have AZBs distinct from their district boundaries. Those districts are not included in our counts of 1990 data. However, they are included in the “all years” count since we have complete data from later years when there were additional schools open and AZBs in place.)
This is exciting progress! Even more exciting, we have recently made these data publicly available in their raw, undigitized format on our website. However, our data collection efforts have been hampered by a number of systematic barriers that have shaped our sample in nonrandom ways.
Barriers
There are limited federal- and state-level sources of longitudinal AZB data. The School Attendance Boundary Information System (SABINS) was the first national AZB data collection effort; it collected and digitized AZB data for about 600 school districts in the 2009-10, 2010-11, and 2011-12 school years. The U.S. Department of Education (ED) then ran the School Attendance Boundary Survey (SABS), which drew from SABINS data and collected additional data in 2013-14 and 2015-16. SABS did not continue after 2015-16 as further collection cycles would have required more long-term infrastructure planning, which ED had to balance against other data priorities at the time.
At the state level, only 3 states have ever collected and published AZB data for all of their school districts. Minnesota has collected these data every year since at least 2002, and it stands as a great example of data availability and access. Delaware also collects annual AZB data for every district in the state, though it is unclear when collections began and the state does not keep historical versions of the boundary files on its website. Finally, Oregon collected AZB data in 2010 and has intermittently updated it. Other than in these three states, we have not been able to locate any additional statewide sources of AZB data. (If you know of something we don’t, please email us!)
In the absence of statewide data, we’ve obtained the vast majority of our data by requesting it from individual school districts, oftentimes through Freedom of Information (FOI) requests. Districts’ responses to our requests have ranged quite a bit, in large part due to inconsistent data access laws. FOI laws vary by state, and most prohibitive are laws that explicitly prohibit (or have been interpreted to prohibit) requests from out-of-state residents (e.g., Arkansas, Alabama, Delaware, Georgia, Missouri, Tennessee, Virginia). In addition, many laws allow districts to charge exorbitant amounts of money to fulfill requests—creating a chilling effect in requests—and others allow districts to deny requests that place “unreasonable burden” on staff. Even when districts responded to our requests, data retention practices shaped what they were able to provide. Many districts told us they do not hold on to any historical AZB data—some citing events like malware attacks or floods. Others pointed us to specific data retention laws that encourage the destruction of older records. For example, Arizona state law cautions that “[k]eeping records longer than the retention period poses financial, legal, audit and investigative risks.” Though we cannot know for certain why districts respond to our requests the ways they do, they may very well be influenced by their perceptions of the risks surrounding AZB data. AZB data are important and can be quite contentious; a recent SD Notebook post highlights research on some of the “racial power dynamics” present in rezoning processes. Because of their potential to stir up tensions, AZB data may be closely managed by district staff. Vague FOI laws and restrictive data retention laws can give districts cover to keep their AZB data obscure.
Finally, there are limits on the quality of AZB data we’ve collected. AZB data are a form of spatial data, which many educational systems don’t have the capacity to create or maintain. For instance, most districts don’t have the resources to hire in-house GIS analysts who use geospatial software to create digital maps. While some districts might partner with local county GIS offices or hire private demographic firms to create digital maps, this can also be costly and is not always an available option. Consequently, many districts shared non-digitized versions of maps, including static images or text-based descriptions of boundaries (see images below for examples of data types). While non-digitized forms of data are still incredibly informative, we will ultimately have to digitize them ourselves before analysis, and the digitization process can introduce uncertainty and inaccuracy—especially when it’s based on low-quality data. For example, we have to make assumptions about exactly how boundaries cut around specific city blocks, which side of the street boundaries fall, and whether boundaries follow true roads or the simplified lines depicted. In this way, disparities in map quality across school districts ultimately mean varying levels of data certainty and accuracy in the final product.
Examples of AZB data types
Digitized geospatial vector data  Arizona district Arizona district | Static map – Photograph 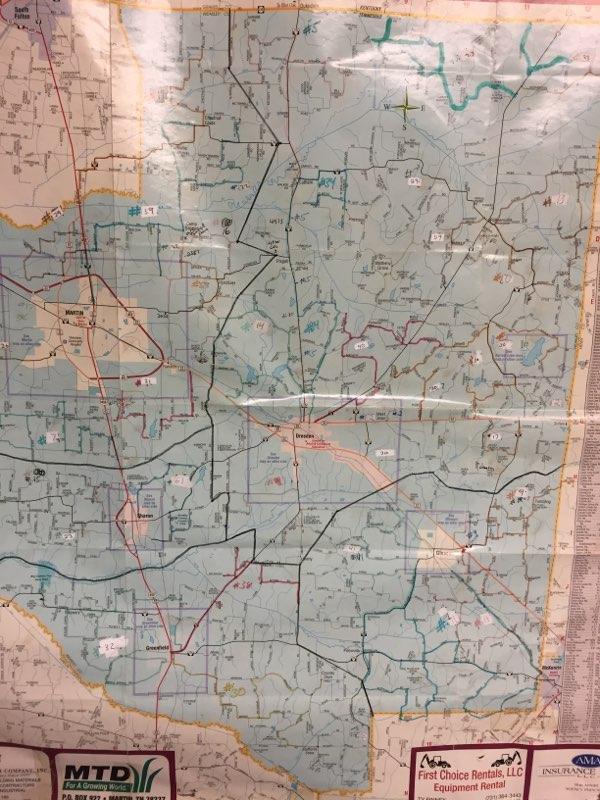 Tennessee district |
Static map – High-quality PDF 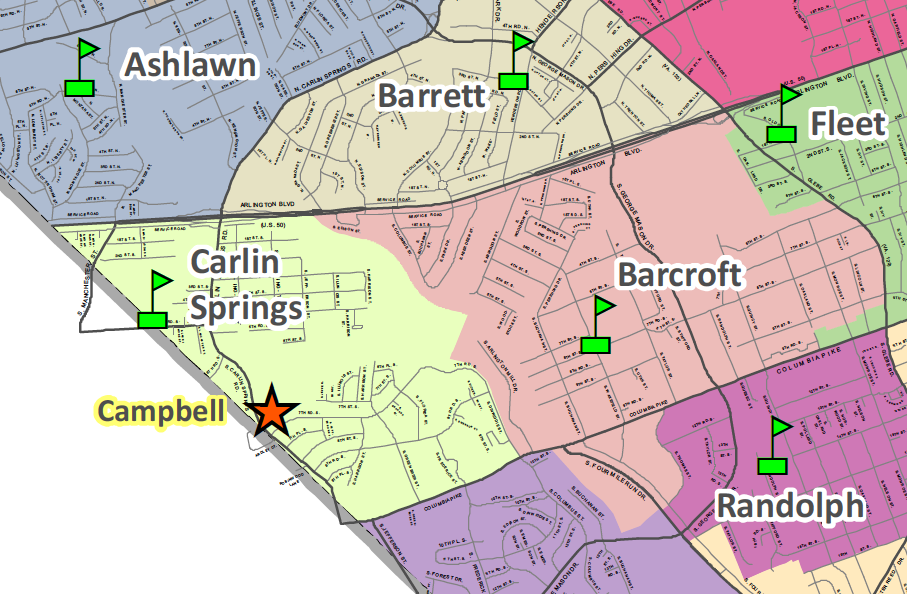 Virginia district | Static map – Low-quality PDF  North Carolina district |
Text – Street addresses linked to schools  Pennsylvania district | Text – Narrative description 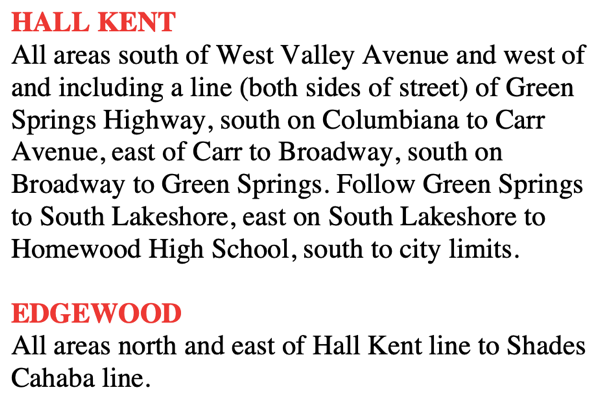 Alabama district Alabama district |
So, what are the implications of all this?
The barriers described above have left us with a nonrandom sample of AZB data, which ultimately shapes what we can know about how AZBs operate in different kinds of districts across the country.
As one example, we currently have more data from school districts with larger enrollments in comparison to those with smaller enrollments. Relatedly, we also have more data from urban and suburban districts in comparison to rural districts. This could be due to the fact that large and dense districts are more likely to have the administrative capacity necessary to employ staff devoted to creating and sharing AZB data. The data gap in rural areas and towns limits our ability to study patterns and outcomes of boundary changes there. Recent research shows that rural school districts are diversifying, but segregation there is understudied. The lack of AZB data from rural districts means patterns of rural segregation may continue to be under-studied, which ultimately hinders the practitioners who could address such segregation.
We also have less data from districts with racially and economically isolated student bodies (i.e., districts with more than 75% of students identifying as Black or Hispanic and more than 75% of students receiving free or reduced-price lunch). While we cannot know exactly why individual districts did or did not provide data, districts with predominantly White and/or affluent populations are more likely to be better resourced than districts with high rates of minoritized students, so they likely have greater staffing capacity to both create AZB data and respond to requests for data. Given how AZBs shape access to opportunity, this lack of data is concerning as it limits understanding of how boundaries have operated over time in districts with higher percentages of historically marginalized students.
As a final example, we are more likely to have digitized geospatial vector data for urban districts compared to suburban districts. This means we will have to digitize—and therefore potentially introduce more uncertainty—for districts in suburban areas. This is concerning because research has documented how suburban districts may respond to diversifying populations with minute, segregative boundary changes that they may try to keep under the radar. For example, districts may tweak boundaries to zone individual homes or apartment buildings to specific schools. Such small changes can be difficult to depict on static maps and our digitization process may not precisely capture such gerrymandering, leaving us with inaccurate estimations of segregation.
Based on our experiences thus far, we make a few recommendations to support the systematic study of AZBs over time.
We urge the federal Department of Education (ED) to collect AZB data once again in perpetuity. We believe AZB data are critical piece of ED’s mission to “collect data” and oversee research on “most aspects of education.” ED could reinstate SABS, which previously ran through the National Center for Education Statistics. Or, it could collect boundary data through the Civil Rights Data Collection, an effort specifically tasked with collecting data on civil rights issues. A new AZB data collection effort at the federal level may be easier than it was in the past given recent advances in browser-based GIS software and the ability to crowdsource spatial data.
States can also help in the effort for top-down AZB data collection by providing spatial data infrastructure and revising data access laws. States could build GIS infrastructure to serve their local districts. It is unreasonable and inefficient to expect every individual school district to invest in GIS resources and maintain high-quality, digitized maps. State departments of education could do this instead, thereby reducing the burden on individual districts and systematizing AZB data. States could also require school districts to publish updated AZB maps on their websites, something that not all districts currently do. Finally, states should revise data retention laws that allow, or even require, districts to destroy historical boundary data. These data don’t have protected student information that would be risky to store. And they’re vital for understanding past patterns of segregation in order to inform more integrative future boundaries.
In sum, because of the limited federal- and state-level AZB structures that we’ve described, our data collection has been mostly driven by the responses of individual school districts, which are shaped by a host of local-level factors. Our research brief considers the ways in which our knowledge of AZBs may be limited by both the availability and quality of our data sources and we propose several policy changes that would better support systematic AZB data collection going forward. Ultimately, we believe we can support greater equity in education by creating a stronger system of AZB data development, reporting, and analysis.
Update (1/30/23): The research team from Penn State wrote a summary of their project for Phi Delta Kappan, focusing on the ways that AZBs have changed over time in Montgomery County, MD, Howard County, MD and Fairfax County, VA. One key finding is that “AZB changes across these districts have contributed less to increases in racial segregation in more recent years, though they also have not yet been realized as a force for desegregation.”

Pingback: Around the College: Nov. 9, 2022 - Blackamericahealth