A new report puts concrete (and indeed shocking) numbers on something we know anecdotally: White families with kids leave the city (in this case, Boston) when their kids get to be school-aged. Released last month, Kids Today from Boston Indicators looks at how these (and other) troubling trends have contributed to increased segregation in Boston’s neighborhoods and public schools.
The report has three parts, starting with city-level demographic trends and working towards school-level demographic trends. Media coverage has focused on demographic changes in the city as a whole, without connecting those trends to the very troubling school segregation numbers in the report’s third section. So, I’ll try to do that here, highlighting key findings and then concluding with comments from the report’s lead author, Luc Schuster.
As highlighted in this Boston Globe story, the report found that:
- “Since 2000…the population of school-age children in Boston has fallen by nearly 10,000 — down about one-tenth — even as the city as a whole has added 10 times that many people.”
- “The result of the slow-moving exodus is a city with barely half as many children as it had in 1950.”
- Between 1980-2017, Boston lost nearly 6,000 middle-income families and, at the same time, gained more than 6,000 low-income families.
These are troubling trends that gesture towards a sort of Boston dystopia: a mostly childless city populated by twentysomethings, increasingly concentrated poverty, and a hollowed-out middle class. Its impact, though, isn’t necessarily in the threat of a segregated future, but in the troubling reality of today’s segregated schools.
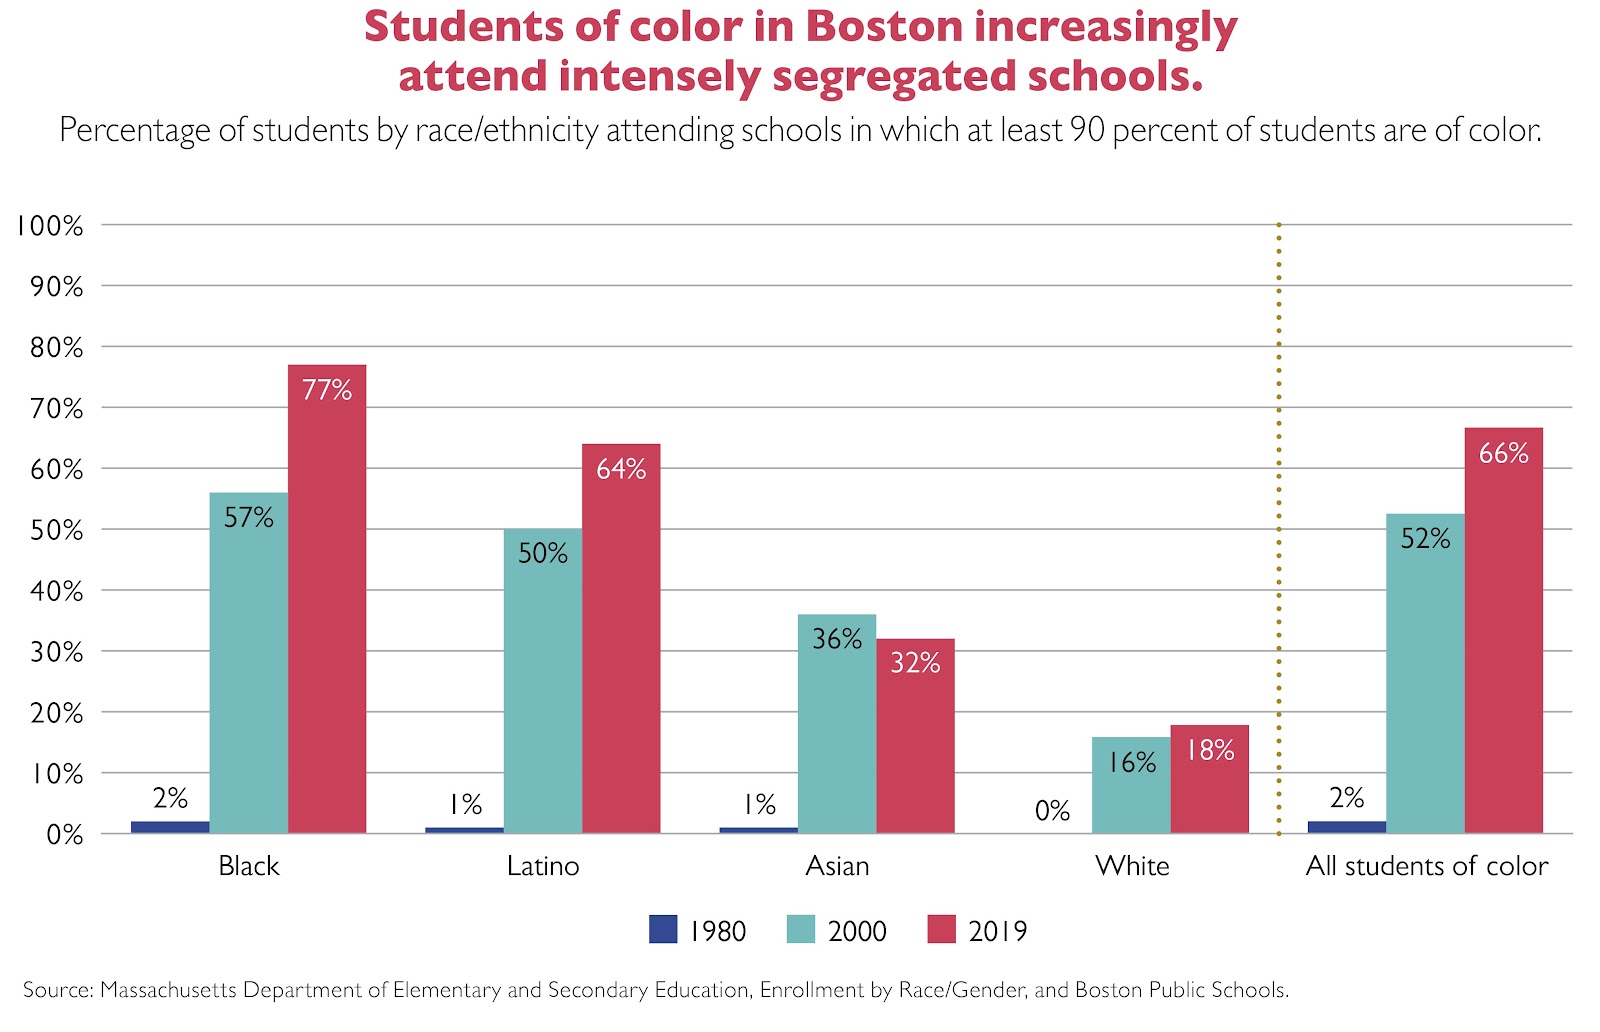
In the section on school segregation, the report identifies trends that I found shocking even as a close observer of Boston schools:
- In 2019, 2 of every 3 students of color attended an intensely segregated school (>90% students of color) in Boston. In 1980, that number was 2 out of every 100!
- Today, 77% of Black students and 64% of Latinx students are in intensely segregated Boston schools.
- More than half of all Boston Public Schools (84 of 117) are intensely segregated.
Those are just the headline findings on segregation. The report digs deeper, finding that:
- Black and Latinx students are not just in intensely segregated schools, but they are often segregated from each other. For example, 42% of Latinx students attend a school where their racial group is the majority, up from 30% in 2000. Troublingly, in a recent report from the Center for Education and Civil Rights, we found the same general trend is true of public preschool enrollment across the country.
- Low-income student isolation has increased across the district. In 2014, nearly every Boston public school (134 out of 140) served a population that is majority low-income. And, there’s been a rise in intensely segregated low-income schools (i.e., 90-100% low-income) – In 1995, there weren’t any such schools in Boston, but, by 2014, that had increased to 15 total schools or 11% of the district.
So, how did we get here? Although the report itself does not outline the following explanations in the way I do, it does offer data to suggest that each of these are plausible. I reached out to Luc to check my interpretations and to offer some thoughts/hope for policy change.
Especially because city school systems are often unfairly maligned in media and public conversation, I want to be clear that factors driving segregation are macro-level factors, sometimes above schools themselves and certainly above the dedicated district and school-based leaders working to make Boston a genuinely strong urban district. Instead, it’s a mix of school policy related to student assignment, access to housing, and perceptions (not actual quality) of Boston’s schools.
Well, busing worked.
Especially in Boston, it’s a controversial thing to say, given our city’s infamous place in school desegregation history. But, the numbers from the report are pretty clear. Boston’s busing plan took effect in the 1974 school year – the change before and after is stark:
- In 1967, there were 101 intensely segregated white schools (90-100% white) in the city; by 1980, that number dropped to 7.
- Similarly, in 1967, there were 25 intensely segregated schools serving students of color; but, by 1980, that had dropped to 3. Just 3.
So, that means the number of intensely segregated schools in Boston has fluctuated from: 1967 – 126 schools; 1980 – 10 schools; 2019 – 84 schools. Also, while there was previously a mix of intensely segregated white schools and intensely segregated schools serving students of color, today only the latter remain.
Segregation increased after BPS ended race-conscious student assignment.
Since busing was implemented in 1974, there’s been multiple efforts to chip away at it. Ultimately, in 2000, Boston stopped using racial composition as a factor in its student assignment process. Then, in 2015, the city switched to a home-based student assignment system for grades K-8 that gives families a list of options based, as the name implies, on proximity to their home as well as the city’s determination of school quality. The chart below, reproduced from the report, shows re-segregation trends since 2000, which (as in cities everywhere) have affected Black and Latinx students most dramatically.
White families with school-aged children (5-17 years old) leave the city.
This has been happening for a long time. In 1970, Boston’s share of school-aged children was about 20%. Today, it’s a little more than 10%. And, Boston is hardly alone. The report notes similar trends since 1970 in: Philadelphia, NYC, Baltimore, Miami, DC, Seattle, and San Francisco. In Boston, “the vast majority of families who leave the city when their kids shift to the first school-aged grouping (5-9 years old) are white.” This is especially common for middle- and high-income white families. Here’s (a snippet of) the key graph from the report illustrating the change in Boston’s overall white population during the K-12 age groupings circled below:
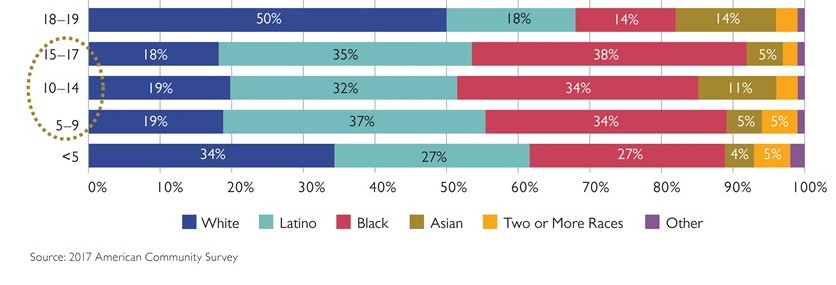
Look at the dark blue band for white students. There’s a few things going on here:
- Lack of affordable housing. Boston housing is increasingly out of reach for middle income families who earn above the cutoff for subsidized housing, but cannot keep up with skyrocketing housing prices in the city. The report estimates, for example, that families at the middle income level would have to save 5% of their income for 30 years (!) before being able to afford a 20% down payment for a median-priced home in Boston. Access to housing is exacerbated by another trend, highlighted in a separate recent report, which found that “housing that’s large enough to accommodate families is occupied by people without children” (e.g., post-college roommates who can pool money to afford Boston’s high rent), meaning fewer units are available for families.
- Perceptions of Boston schools. The report does a nice job of being explicit about this. Though it notes that “there’s a broad-based consensus that Boston schools need to provide stronger educational offerings,” it’s very clear in arguing that “there’s little evidence that schools have gotten noticeably worse over the last 15 years.” This is a hugely important point. Even with further concentration of students in low-income schools, Boston’s state test scores have actually increased since 2000. Graduation rates have also increased. And, Boston continues to score higher than other large districts on the NAEP test. Instead, the report argues that “perceptions of school quality have been closely tied to implicit (or in some cases possibly explicit) racial biases,” citing this study from Jennifer Jellison Holme as evidence. Other studies are similarly clear: race is used as a proxy for school quality, over and above the actual quality of the school.
As always with my research roundups, there’s more in the report, and I recommend a full read. In addition to what I’ve written about, the report has data on demographic enrollment differences at Boston’s public exam schools and charter schools. Notably, on the latter, the report reveals that Boston’s charter schools are slightly more segregated (93% students of color) than the district’s traditional public schools (87% students of color). It also has a detailed section that explores within district segregation – e.g., whether district schools match the overall district demographics.
But, I wanted to give the final word here to the report’s lead author, whose commentary adds nuance to my summary, especially in considering Boston as an example of larger national trends. His point about immigration, also, is especially pertinent given our current political climate. Lastly, although the report is not oriented towards policy recommendations, he was kind enough to conclude with some thoughts about how we orient policy and parental choice towards integration.
Do my explanations seem reasonable? What have I left out?
Yeah, your explanations seem right on to me, and I appreciate you building off of our school segregation research. It’s important to tie these trends directly to conscious policy choices, just as you do here: court-ordered school desegregation efforts (i.e., busing) really did help integrate our schools in the late 70’s and 80’s, and then putting a greater emphasis on neighborhood proximity in more recent years has contributed to resegregation.
One thing you left out is the role of national forces in driving some of these local trends. It’s harder to know how to address these here in Boston, but they’re important context to keep in mind. I’ll give three examples: 1) Americans are having fewer kids across the board, so the school-aged population share has declined everywhere (it’s just even lower in cities like Boston); 2) increasing income inequality has led to a hollowing out of the middle class everywhere, not just in Boston; and 3) increasing international immigration has actually helped push back a bit against some of these trends. Without new immigrants to Boston, our school-aged population almost certainly would have declined even more (which is a scary thought).
There are a lot of fascinating findings in the report – what stood out most to you?
Here’s a small, yet important data point that I didn’t appreciate going into the research: I knew that Boston had lost a lot of white school-aged kids, but I didn’t fully appreciate how many black school-aged kids we’ve also lost to other parts of the region. From 1980 to today, we’ve lost 30,000 white school-aged kids versus a loss of 7,000 black school aged kids. BUT, when looking at the more recent timeframe of 2000 to today, we actually lost fewer white school-aged kids (a 4,700 white decline vs a 8,400 black decline).
How could policy (in housing, schools, etc) begin to reverse the trends noted here?
This report really is more description than prescription. And since these trends are long-term, they’re driven by so many different factors. That said, I’ll list a few policy responses that seem worth considering:
- Almost anything we do to make housing more available and affordable would help keep families in the city.
- Boston has done a good job (at least relative to other cities) at providing income-restricted housing for lower-income residents, and this is one reason why we’ve actually seen an increase in low-income student enrollment in Boston schools. But this housing could be much more evenly distributed across the city–45% of housing units in Roxbury are income-restricted versus only 3% in West Roxbury. If we did spread it out better, there’d be less residential income segregation contributing to school income segregation.
- Almost anything we do to improve the educational experience of kids in Boston schools would help keep families in the city.
- Behavior change efforts like the Two Tour Pledge from Integrated Schools seem really helpful in reversing the unfair negative perceptions that many higher-income parents have about attending schools lower-income schools that predominantly educate students of color.
- I’ve heard some interesting arguments that high-quality, universal pre-k can help new families consider investing in the public schools in a way that they might not otherwise. Maybe you get a seat for your 3 or 4 year old, dip your toe into the district that way, and if you have a good experience, you end up more likely to say in the system, rather than move out of the city or switch to a private school (if you could afford to do those things)
Update (July 2024): A recent analysis from Boston Indicators illustrates that the trends described in this post have continued since the publication of the Kids’ Today report. In particular, moderate- and high-income white families continue to leave the city when their children reach age 5 and begin kindergarten. In the chart above (based on 2017 data), white families made up 34% of all households with children below age 5, and that number drops to 19% for families with children in the age 5-9 range. By 2022, those numbers have improved, but only slightly: white families make up 33% of households with children below age 5 and 24% of families with children aged 5-9.
To me at least, this quote from the report contains the most important takeaway: “Boston’s population increased 24 percent from 1980 to 2022, but the number of 5- to 17-year-olds decreased by 29 percent at the same time. And were it not for immigration, Boston’s school-aged population would have decreased even further.” Basically, even though people are returning to the city, they’re still leaving for k-12 schooling, and increased immigration should get a lot of credit for saving the city (and public school district) from an even steeper decline in enrollment and related financial devastation.

Pingback: New Project & Data Request: Attendance zone boundary changes | School Diversity Notebook
I admire your enthusiasm for justice, but there are some critical leaps you make that are not supported by data. You lead with “white families with kids leave the city” but so much of that is “middle class families with kids leave the city.” Which yes you acknowledge here and there but your lead and headline doesn’t.
You say ” ‘there’s little evidence that schools have gotten noticeably worse over the last 15 years.’ This is a hugely important point.” And then draw the conclusion that is primarily about racial bias. That is a sweeping, damaging and unsupported leap. A few points:
a) The schools haven’t much better either. The physical condition of schools, the facilities offered, the range of subjects outside ELA and math and sometimes science, etc etc. BPS is simply not providing an adequate education TO ANYONE IN ANY ELEMENTARY SCHOOL.
b) The comparison to make isn’t to other cities (your “Boston doesn’t fail as much as other cities” comment). It is to the educational options in metro Boston towns. Which have new or at least decent school buildings, actual athletic fields, a full range of subjects, etc, etc. There’s a VERY good argument that BPS has gotten relatively worse.
Or compare it to Cambridge if you want an urban location where they have made education work.
c) The context has gotten A LOT worse. It used to be families could move to somewhere in the city for affordable housing. Now there is no affordable housing anywhere. Which you mention, then pretty much ignore as a driver of movement. It is arguably the most important factor, has been for many years, and is now just an overwhelming factor.
Also let’s see the study of what the non-white middle class is doing. I’m betting that it’s the same now, especially in the last few years.
Attributing the changes in segregation from 2000 to 2019 to the changed assignment plan? The actual evidence in the study that was done shows only a slight change from the assignment plan. So no offense intended but this is not supported by the available data.
It would help to note whether you consider Asians to be people of color in the various data and references.
This is also about inequality (income and wealth) and the crazy way school districts are organized and funded.
LikeLike
Pingback: New Research: Literacy outcomes in segregated schools | School Diversity Notebook
Pingback: #KnowBetterDoBetter, Part III: A conversation among White parents, advocates, & educators about school integration | School Diversity Notebook
Pingback: Boston Media & the “Busing” Narrative | School Diversity Notebook